I’ll level with you: there is no way I could afford even a base Model S.
In Australia the absolute base standard model is over $110K. That includes all discounts and incentives – of which, thanks to our backwards government, there are few.
I drive a Nissan X-Trail (the last of the “boxy” X-Trails from 2012). The wife has a Yaris. So we’re not “rich car” people. Even the base Model S is about 3 times the cost of the most expensive car I’ve ever owned.
However, in good news, today’s test drive was not in the base Model S.
I was in a dual-motor Model S 90.
RDJ APPROVES!
I have been thinking about owning an EV for a long time now, and about how it would feel, and how it would respond.
O.M.G
I was unprepared for the sheer awesomeness of this event. The lightness of the steering, the road responsiveness, and that is without me even thinking about the tech that underpins the whole thing. Sure, I’m not a luxury car drive ordinarily, but MAN!
We spent a bit of time driving around Sydney’s lower north shore, getting a feel for the capabilities and luxury of the beast. And the silence, which I found a little unnerving at first, but quickly learned to laugh at… somewhat deliriously.
What I hadn’t appreciated previously, when freaking out about the Model S, was the simplistic elegance of the design. Besides the main screen with all its configuration (handled wonderfully by Adele from Tesla, guiding us on our magical space journey), everything is really thoughtfully laid out and simple to operate.
You just get in, and drive, and nothing about it is an issue, even for a first-timer. Well, except the left-side indicator stem… European layout… Hmph. I’m just used to Japanese cars so no biggie.
We experimented a little with the different modes, and it was really amazing how quickly the car shifted to Sports and Performance modes. You could feel the suspension and steering sharpen up as soon as Adele switched it over, even at 60 km/h.
We also drove past an Audi R8, and we all had a good laugh at the difference in price versus performance.
The Autopilot was really cool at notifying cars and other objects that were within the car’s sphere of influence. It was really noticeable how different the layout was to other cars I’ve driven, particularly the space down the middle of the vehicle, and smart use of every area.
And then, there is that acceleration… I’ll let this short video (and my daughter) do the talking…
Many sources claim that hybrids have come to help people save the environment while they take care of their daily tasks simultaneously. According to Autoblog, it has passed a long time since the Toyota Prius was first released to the public, and it has become one of the best-sold cars in North America.
The main reason people decide to buy the Prius is that it helps them save some money regarding gas, and supposedly, it helps you lessen the impact of your carbon footprint. It is known that cars are one of the most excellent sources of pollution, spreading different toxic gases into the air that cause harm to the atmosphere and humanity in general.
Many people, especially those who claim to be eco-friendly, claim that purchasing a Prius is the same thing as “investing in the environment.” However, is it really like this there is something else going on regarding hybrids?
When Prius was revealed, Toyota spent some good money on marketing. But is all this hype really the truth? Have a look at my previous post why Toyota Prius is bad for the environment.
A study found out that a Hummer is more eco-friendly than a Prius.
According to Slashdot, if we take into consideration all the processes it takes to build a Prius, a more significant problem comes to light. Besides requiring more energy than the regular car to be completed, the Prius also goes through different factories around the world to be completed.
A Prius uses two engines, an electric engine, and a standard motor. However, building this hybrid battery takes a lot of energy. It can cause significant harm to the environment thanks to the release of toxic gases (such as sulfur oxide) during the production.
Many people may think all these problems may be worth it in the end, but that’s very far from reality.
Building a hybrid car causes more harm to the planet than you think.
A hybrid car’s building process is hugely similar to what it would be like to complete a regular car. However, in both processes, ample amounts of energy are used, especially when it comes to forging metals, like steel or aluminum. Other essential materials enter this list as well, like glass or plastic, and a lighter car may require more energy to be built because metals like aluminum are more challenging to forge.
According to an article published by the New York Times, Toyota has admitted that producing this light Prius consumes tremendous amounts of energy and produces more carbon dioxide quantities during the process than building regular cars. The reason for this is the more advanced components necessary to complete such a modern car.
Many people think electricity is more eco-friendly than gasoline, but the truth is that both options are pretty much balanced if we consider all the damage both takes. For example, according to EIA, almost half of the USA’s electricity comes from coal-powered plants.
THE TOYOTA PRIUS IS TERRIBLE FOR THE ENVIRONMENT!
The Toyota Prius is one of the most popular hybrids to this day. However, is it as good as many people claim? That doesn’t seem to be the case this time. Many people claim this is the “ultimate green car;” however, it has become one of the most significant pollution sources in North America.
Some even dare say that the Toyota Prius can be less environmentally friendly than a Hummer, and that’s a lot to say.
The Toyota Prius’ architecture can be quite complicated, which means it will take more energy to produce it than other cars. This popular vehicle contains two engines, a gas engine, and an electric motor. The electric motor can make the car go around 25mph, and after that, the gas engine will start working. So, it seems like this car was made to save as many resources as possible.
Yes, all this sounds like a trip to a flower field, but the reality is much worse than that. During this car’s official release, Toyota wouldn’t stop boasting about the car’s supposedly 60 mpg and 51 mpg in highways. This is one of the main facts that made many people complete their purchases; however, some of them started complaining about the car not working as the company claimed it would after some time. An outdated test by EPA found out this statement to be true.
However, this sounds terrible; it is just one of the main facts that make this car a wrong purchase. The second fact is directly related to the production of batteries for these cars; hybrids, to be specific. It was only a matter of time until it was discovered that the nickel batteries are not environmentally friendly, according to Dan from Car Removal Perth, a local car disposal company based in Perth!
The batteries for the Toyota Prius are manufactured in Sudbury, Ontario. It is known that this plant causes enormous environmental damages to Sudbury’s surroundings, and there are no signs of life around the “dead zone,” the same area the NASA used to test moon rovers. One thousand tons of these batteries are produced yearly. Imagine all the damage this can cause. However, this is just the start of this process.
After processed, the nickel is sent to Europe, then travels to China and then is polished in Japan. There is a lot of energy invested in creating one battery if we count all the factories used to complete the product.
If you take this fact and compare it to a Hummer battery’s production process, you can conclude that building a Prius takes about 50% more energy than completing a Hummer.
So well, to summarize, a Prius (and all hybrids) is not precisely what the companies and enthusiasts think it is. When you purchase a Prius, you’re empowering and giving the company more ways to keep manufacturing batteries that are heavily damaging to the planet.
One thing that many people recommend if you want to help save the planet is buying a subcompact that uses a PZEV rated engine. Not only will you save money, but the planet will thank you in the long-run.
Was working from home today when the wife asked if I wanted to join her for lunch at a nearby shopping centre. It helped that she sent me a shot of a Tesla Model S on display.
Before the phone hit the ground…
That’s me in the distance….
Arriving out of breath, perhaps having broken several land speed records, I got a glimpse of it, and it was a P90D! Not the first Tesla I’ve seen in the wild, but definitely the first stationary one I’ve been this close to.
I took the time to walk around the car, introduce myself to the Tesla staff on hand, announcing my status as a Powerwall owner. They were excited to meet me, but not nearly as excited as I was just to be near it.
After examining it from all angles, Ieased myself into the sweet, sweet luxury of The Magical Space Car for the first time.
Oh man… if I was a smoker, I’d suggest a cigarette was in order…
I make no apologies for any spelling mistakes or grammatical errors here, BTW. I’m too excited to care.
I played with the massive touch screen for a little while, pressed all the buttons, and also took time to check the back seat for room.
Only thing I’d have to criticise is the rear head room was a bit tight if I sat up dead straight and tipped my head back. No complaints about seat comfort though. And that body work… mmmmmm…
This model had a few upgrades that one can’t experience while it is immobile in a shopping centre. The base model shares a lot of the same interior features of course. Just a shame even at basic RRP here in Australia (starting around AUD$130K), it will remain out of my price range.
But it was great just to hang around for 10 minutes and discuss the car, the opportunities, the upcoming Model 3, and charging infrastructure.
He’s practically the Silver Surfer, but using a car instead of a surf board.
After about 15 minutes of geeking out, talking to the Tesla staff, and answering questions for other customers when things got busy, I sadly had to leave.
I was going to put a deposit down for a Model 3 at launch, to replace my wife’s car. Around the same time, she picked up a job with a car as part of the package so that plan went on the back burner.
I figured, since it was a Ford Fiesta with a very efficient engine, it was at least part way to the green aspiration I have of an electric vehicle.
I’ve had the Powerwall six months now, or in fact a little longer. It would be more accurate to say I’ve had a functioning solar PV with battery system for seven months.
That dates back to when my meter was changed over to a basic bi-directional unit. Importantly, it is the date that billing with Diamond Energy started, with full and accurate detail of import and export.
I have had a total of three bills, the most recent of which covers 52 days from mid-June to early August. It stops there because I’ve moved from single-rate to TOU tariffs, so Diamond decided to make things easier for calculation purposes.
This post will put up the basically points of interest from the three bills and their relevant statistics.
POWERWALL SIX MONTHS ANALYSIS – PART 1
The first bill covered the period of 17th February through to 23rd March.
Item
Days
Cost
Import
Export
Total
35
$23.89*
121
322
Average / day
–
$0.68
3.46
9.2
* This amount removes the $20 establishment fee with Diamond ($22 inc GST)
With a connection fee of just over $0.82 / day, and an export tariff of 8 cents/kWh, I was almost covering the connection.
Of course, import was going to hit a bit harder in summer time. The last week of February was a record-setter in Sydney.
The temperature was minimum 26oC / 79oF for nearly the whole week. Frequently the temperature was over 35oC (95oF) in the late afternoon, hitting those big, west-facing windows. I can only sweat so much!
That kind of heat requires air conditioning, which you can see in the red spikes below.
It probably wasn’t even the amount I imported, more a case of when it was imported.
This is a small precursor to what you can expect from an Australian summer in this part of Sydney region. No ocean breezes this far inland.
During this period I clocked some fairly hefty production figures, topping out at around 34kWh, with several days in excess of 30.
The heat of a Sydney summer makes me a little cautious in regard to power usage. In addition to the extended hours for the pool, the heat will require air conditioning. That means import.
January tends to be the wettest month in Sydney, and storm season.
POWERWALL SIX MONTHS ANALYSIS – PART 2
The start date was 24th March, running through until 17th of June, 2016. This was the big quarterly bill which grabbed the media attention here in Australia, with a few overseas articles published as well.
I won’t go into too much detail but the key data to consider
Item
Days
Cost
Import
Export
Total
86
$50.39
244
736
Average / day
–
$0.59
2.84
8.6
Previous bill
–
$0.68
3.46
9.2
Difference
–
-$0.09
-0.62
-0.6
As you can see, the daily figures show slight decreases across the board.
At my import tariff, this equates to 13.2 cents / day decrease in costs as I’m importing less.
The export is 4.8 cents / day cost increase as I’m exporting less.
This comes out to 8.4 cents per day. The actual decrease of 9 cents per day is due in part to rounding.
Additionally, Diamond single-rate tariffs step up by a small amount once you use more than a certain number of kWh per month.
The weather during this period was pretty good. We had long weeks of sunshine, with few rainy days. The temperatures were very mild, meaning we didn’t need air conditioning or heating.
POWERWALL SIX MONTHS ANALYSIS – PART 3
The latest bill runs from 18th June through to 9th August, or a total of 52 days over winter.
In terms of “winter”, I should mention it never snows here. The closest snow I think fell about an hour’s drive away, in the Blue Mountains. It isn’t frosbite territory, and with the climate warming, isn’t ever likely to be. Short of another ice age, I guess.
We do get frosts, sometimes on consecutive days, and the lack of double-glazing, with basic wall and ceiling insulation batts, does mean the house gets cold. We also have a lot of tiled floor.
This bill gives a valuable insight into the changes that occur, in a period with less sun and more heating.
Item
Days
Cost
Import
Export
Total
53
$67.25
288
335
Average / day
–
$1.27
5.43
6.3
Previous bill
–
$0.59
2.84
8.6
Difference
–
+$0.68
+2.59
-2.3
A little over double for daily cost, and the reasons why are fairly obvious.
Import rose by 91%, and export fell by nearly 27%. So it cost me an extra 50 cents per day for import and I missed out on around 18 cents for export. In the ballpark at 68 cents.
There were only a couple of days where we ran the heating longer than an hour or so. With the big motor on this ducted system, that was more than enough to start hitting the import hard.
Next winter, with TOU now in place, we’ll be a bit smarter. I’m talking to Reposit about the best ways to utilise off-peak power, and how their software handles it.
Note: the reason behind the short interval for this bill is replacement of my meter. The GridCredits scheme is reliant on a sophisticated unit, which I’ll put up video of when I get the time.
SUMMARY
Putting all the information into a table gives a nice summary of the solar with Powerwall six months down the track.
Item
Days
Cost
Import
Export
Part 1
35
$23.89
121
322
Part 2
86
$50.39
244
736
Part 3
53
$67.25
288
335
TOTAL
174
$141.53
653
1393
Daily avg
–
$0.81
3.75
8.01
Not bad, though of course I have yet to experience a full summer with this system.
Summer will mean more power imports as we use the air conditioning. It also means longer daylight hours. Greater export will offset higher import, to a degree.
Compared to winter, where heating and shorter daylight hours have clearly had an effect, summer should be slightly better. I’m still at the mercy of those 40oC+ days, but at least I can pay them back a bit.
Of course, as panel temperatures rise above 25oC, efficiency will drop. More light = more heat in summer, so I might not see many days above 35kWh with the existing system.
Autumn and Spring are looking like the “Kill Bill” (*snigger*) periods for the year. The milder weather and lower heating/cooling requirements are really where its at.
Not bad for 6th September…
Winter is going to be an issue ongoing, with lower daylight hours, and heating requirements. Summer will still need a lot of electricity imported, but can be offset with big exports.
The real challenge, moving forward, is to maximise self-consumption, and minimise waste. As always.
If I can keep the costs below $1 / day for my electricity, even with recent increases in tariffs, then I’m well on track to save $1900 in the first year. Maybe more after that!
Now is the winter of our discontent
Made glorious summer by this sun of York;
And all the clouds that lour’d upon our house
In the deep bosom of the ocean buried.
– Gloucester, Richard III (William Shakespeare)
OK so perhaps I’m using that a bit out of context; where Glouceser is speaking on a time of unhappiness past, I’m in the middle of winter, and I’m fairly discontent!
Mainly because it is one of the coldest winters in Sydney for about 20 years so far, with some record days in terms of low temperatures. I’m not even going to type that much because a warm bed is calling me.
Frost isn’t unusual for Sydney, of course, particularly in the western suburbs. But it has hit a little earlier than I remember, and daytime temperatures are staying in the mid-teens, or around 60oF.
This is Australia for goodness’ sake! We don’t DO cold.
That attitude is reflected in our lack of double glazing for standard housing. If I had the money, I’d give it some serious thought.
What it has meant for the UTP household is an increase in imported power as we run that (cursed) ducted air conditioner for heat.
Here are some of the dials, edited to exclude GridCredits/Battery, from Reposit Grid Portal, Wednesday 29 June.
This is the general pattern on a bright winter’s day – we get up and consume a whack of energy in the morning, with the ducted heating adding to the breakfast needs. The green spikes on the top right are around 5kW consumption, mostly import.
The Powerwall is typically exhausted by morning in this weather, due to evening heating requirements. This is utterly necessary to prevent widespread misery, wailing, and gnashing of teeth.
I’m not even complaining about the heater usage because brass monkeys are getting distinctly uncomfortable. Its that cold.
Get the ice scraper, Edgar… and the thermals…
My solar generation is still kicking a fair amount of butt on the bright days, with the light hitting the panels from around 0730 hours through to around 1630 hours here. It’ll get up to around 3.8kW in the middle of the day.
That is a fairly good amount of power considering we’re in the shorter daylight period of the year. A week earlier, right around the equinox, I did 21.5kWh which is pretty schmick. Either side of that, it was closer to 12.5kWh as intermittent cloud interrupted my flow.
I’m even exporting a few kWh because the battery is still filling up before midday. On cloudy days, I’ll turn the pool equipment off to save about 1.5kWh of electricity as well. So while its not all gravy, its still cheaper than having no solar/Powerwall at all!
Its just addressing those morning and evening heater requirements that is the issue, and even with the thermostat set to 19oC, there is a fair bit of juice needed to kick the old girl off.
I’m getting a meter changeover done so that I can move to time-of-use. This will take full advantage of Reposit’s ability to charge the battery off-peak and deploy that power when I need to head off peak running.
Speaking of which – first bill due in the next week, so expect excitement!
As already sprayed around on twitter, I have a system installed within my solar domain from a startup called Reposit Power. When I first discussed the install with Natural Solar this was one of the key points in the install; a smart way to use battery power, as well as help reduce my costs.
If you didn’t watch the video, in a nutshell:
Reposit Power provides controller software that adds smarts to the system I have, as well as offering the ability to sell battery power to the grid during peak events (GridCredits).
The SolarEdge inverter with StorEdge Battery interface is quite happy playing with the Powerwall. When the sun is out, it powers the house, directs any leftover to the Powerwall, and exports the rest. Battery is called on when solar is not available. Simples.
Reposit Power takes this ecosystem and adds a layer of predictive analysis, including my usage patterns, type of energy tariffs, and weather patterns, to decide on the best way to manage this power on my behalf.
This is the kind of technology that other companies are selling out of the box, but Reposit are making it applicable to multiple systems. This device-agnostic approach is very important as we move deeper into the IoT (Internet of Things), particularly with connected energy systems.
Reposit Power also provide a sexy, sexy web interface for looking at power usage. Here is a sample from 13th May:
Friday the 13th …
It has a level of granularity slightly better than the SolarEdge web interface, which is really useful to understand house consumption in particular.
My favourite thing about the image above is the Solar generated – almost a perfect curve, gracefully rising from 0720 hours to 3.6kW through midday, and then falling to zero again just before 1700. Beautiful…
Fine… but what does it mean?
At the moment, I’m probably not taking full advantage of the Reposit setup, because I am trying to be the smarts in the system. And while I’m a control freak, there are factors beyond my control.
The guiding philosophy is to use devices when the sun is out, and get the battery to run the house when its not. Life sometimes gets in the way of that, though more often its cloud cover getting in the way of that.
A couple of days in a row of decent cloud cover, or rain, and the battery is going to roll over and go to sleep until the sun comes out again. As we head into winter here in Australia, daylight hours will shorten somewhat.
(I’m still cranking 20+ kWh on a clear day in which is doing alright for a latitude of 33.7S).
If I’m importing power from the grid once the battery gets low, I’m paying a bit over 20c / kWh for it. That means I might spend $3 on power on a day where I have cloud cover, looking at the average consumption.
Winter will require more power consumed on heating, so that cost will go up on a cloudy day. Single rate electricity tariff gives me a level of surety with my consumption, but perhaps to maximise the benefit, we need to shift our thinking and take a bit of a risk.
Reposit Power to the rescue?
In discussions with the guys at Reposit, I’m considering moving to a TOU (Time Of Use) tariff with Diamond Energy. Let’s look at the costs involved in TOU before any discounts apply:
Rate Description
Time Period
Cost inc GST
Daily Supply Charge
–
101.20c / day
Peak Rate
1300-2000 business days
32.84c / kWh
Shoulder Rate
0700-1300 business days0700-2200 weekends
0700-2200 public holidays
25.30c / kWh
Off-peak Rate
2200-0700 every day
12.27c / kWh
Compared to the current single-rate of 82.45c / day for supply charge, and the 21.29c / kWh for usage, this could be either terrifying or awesome.
The connection fee increase to go TOU from single-rate is nearly 23%. Over a billing period (quarterly) is a difference of just over $17, or $68.25 in a year. Not huge, but I’m trying to get as close to zero as possible; the related benefits have to stack up.
Peak rates are going to be the killer – 54% higher than single-rate. Ouch.
Shoulder power rates are nearly 19% more expensive than single-rate, which is where quite a bit of our usage probably sits, based on my quick API-based calculations. That is something to put a red line under in considering the switch.
Off-peak power is while off-peak is 42% cheaper than single-rate, so can it help?
Certainly – running the dishwasher overnight is an obvious one, as it has water heating requirements. Water has the highest specific heat of any regular household substance (unless you’re heating Helium or Hydrogen* gases), and therefore needs a lot of power to do it, if only in peaks.
*Author’s note: if you’re thinking about heating Hydrogen gas in your home, just don’t.
What about other devices? Washing machine run before 0700? Perhaps, but ours draws gas-fired hot water so its not a big deal. Hanging washing on a cold winter’s morning doesn’t sound like fun, either.
Oven? Generally not cooking anything between 10PM and 7AM at night. We tend to be asleep or generally less active (and hungry) at those times.
Air conditioner springs to mind as something that needs to operate off-peak as much as possible, particularly in winter where we are warming up the house before getting out of bed. We have a reverse cycle ducted system which sucks a lot of power to cool, so probably a similar amount to heat.
If we had off-peak power, we could time our heating and cooling to maximise use of off-peak power, though that is less useful in summer when the heat is coming in the afternoon i.e. during peak.
However, if we’re talking about the ability to effectively use off-peak power, we need to consider the most useful device on the premises.
If Sydney is going through a cloudy period, and I’m not able to generate enough solar power to both run the house and fill the Powerwall, why not use off-peak power to do it?
Even though its one of the stated benefits of the Powerwall (time-shifting solar and off-peak power) I wasn’t really considering how to do it until Reposit Power came along.
The Reposit Power box is capable of analysing my usage patterns, and understanding that I get up around 0700 every day, flick on a few devices (not simultaneously if I can help it) and make breakfast. Over time it gains an understanding of how much electricity I require for breakfast.
So, if I moved to off-peak power, Reposit could pull that off-peak power in, and reduce my breakfast costs by 42% on days where I don’t have the battery to boil the kettle, compared to what I have today.
What if its a wet week? At the moment I’d trickle a bit of solar into the house, maybe the battery, but my import costs would climb at a set rate of 21.29c / kWh.
If I move to off-peak, Reposit could pull in 6kWh at 42% lower cost, and deploy that power at peak time to avoid the higher rate. I’d take a bit of a hit on the shoulder time, but would be better off overall if the figures work out.
My next step is to look into the exact numbers, and discuss some points of interest with the guys at Reposit Power. Scientifically speaking, I’d like to just let this single-rate billing period finish, then switch over to TOU for the next quarter and look at the results.
Yes, it would be an Autumn compared to Winter comparison, but in theory Winter should be even better for this strategy.
Whether I stop being lazy and look at the figures might be irrelevant in light of another factor introduced by Reposit Power…
GridCredits FTW!
At the moment, I get 8c / kWh for exporting power off my solar generation. Not crash hot, but not bad either compared to some in the Australian market.
One of the reasons for the low rate compared to what I pay for electricity is that solar generation is not a guaranteed resource. It peaks and troughs with available sunlight, and of course doesn’t run at night.
If you go back to the table on power pricing with Diamond Energy, you’ll see “peak” runs from 1300-2000 hours business days. This is generally when most power is required, so companies can sell power for a higher rate as they crank up the hamster wheels.
Even though my solar may be exporting during peak times, the environment today is such that the pricing is not adaptive. Firstly the technology doesn’t really exist at a network level, and secondly the power companies are keen to maximise their projected profit.
This is where GridCredits step in, and home storage steps up.
Anything I have stored in the Powerwall is guaranteed power. Besides a minor amount of efficiency lost in transmission, if I have a full Powerwall, I have about 6kWh available that could go into the grid to help smooth a demand surge peak.
Of course, given this is now a guaranteed source of power, and isn’t subject to interruption from the sun disappearing, I’m going to want decent compensation for it. That compensation works out to a figure state as “up to $1 / kWh”. Yep, a whole, tasty dollar.
And if its a bright day, I can keep pushing power into the battery from the solar panels, or exporting at 8c /kWh. Bonus!
Financially, that is a major windfall for the Pfitzner household, as the first exported kWh will pay for my supply fee that day, and any subsequent kWh exported will cover other days.
With around 77 peak events per year in Australia, with the right conditions I could get that power bill well below zero, and even pick up some beer money.
Beyond my selfish personal gain, systems like Reposit Power are a game changer for the electricity network. Long range power distribution seems a little odd when we’re capable of generating it on our rooftop.
The Rise of the Microgrid
There are a few projects around Australia at the moment that are looking at microgrids, or discrete systems that don’t require the main power grid as we know it.
Think about it like peer-to-peer power sharing. Its basically the bit torrent of electricity.
The concept of a nation- or state-wide grid will probably fade over time. Connected energy systems at the current scale are only 50 or 60 years old, and the concept of connected electricity grids just over a century to date.
I see the grid as something like the automobile, powered flight, or telecommunications. They are all recent innovations in human history, and as such are subject to more rapid change in their short life cycle.
People are naturally resistant to change, and only like a change that introduces convenience, financial benefit, or exceptionally pleasing aesthetics.
Renew Economy ran an article relating to the thought process of microgrids in Western Australia. Asset Manager for Western Power, Seàn McGoldrick, gave a talk on the peculiar set of circumstances in the west. As mentioned in the article from Giles Parkinson and Sophie Vorrath:
… when you have a service area equal in size to the entire United Kingdom, but with just one million customers (as opposed to 73 million), it’s a big challenge – economically and logistically.
The profitability of Western Power is almost nonexistent, but it is an essential service, subsidised by the West Australian State Government to the tune of half a billion dollars per annum.
What if that money could be shifted to communities, to reduce the long-term costs of network maintenance? Provide customers with reliable power, while not having to manage the poles and wires across the wide brown land?
McGoldrick presented four general approaches, and bucked for option 3 below (Modular Network).
Credit: Renew Economy, Seàn McGoldrick
If you take some of the maintenance budget out of the equation, Governments could save money, or put it into development of newer, more efficient technologies.
You create a snowball effect, that can allow low-carbon generation, electric vehicles, and storage technologies to leverage off each other.
I remember having a PC back in the day and moving to Windows. This change forced the need for better components. As CPUs got better, memory had to advance, along with graphics cards, and the motherboard technologies that tied it all together. Something similar can happen with renewables.
There are still issues around reliability for microgrids, but a combination of efficiency measures, storage, and generation diversity (e.g. wind and solar PV together, along with solar thermal) can contribute to advances across the board.
Further, it can remove the issues of the grid going down at some distant location, leaving consumers stranded.
With smarter devices, smarter management, and more efficient housing, domestic microgrid implementations can lead the way. Once the base is established, and more research money flows in, light industry can also benefit as the technology advances in leaps and bounds.
From there, we won’t just be talking about decentralising our power needs, we can start talking about decentralising our population.
If only the government would hurry up and get us a first-world internet. In an election year, anything could happen…
I haven’t blogged in nearly a week due to a lot of time spent developing an interface for the SolarEdge API. The idea is to display results in the PHP environment I have inside WordPress.
DISCLAIMER: this post will be mostly about nerdy developer things, with some added data analysis and chart talk. Apologies if your eyes glaze over; normal service will resume soon.
Back to the (PHP) Future …
The last time I touched PHP was for my rugby club a few years back, with only incremental maintenance on that site since. I also had no experience driving API calls with PHP, or handling the resulting JSON, so there was quite a bit of a learning curve. Foolishly, I didn’t bother setting up a local environment to test, thinking I’d just pulverise it with my mad skillz.
Shyeah.
The last 12 months at work was mostly concerned with learning NodeJS, which made my PHP a little hazy. They share some commonalities, so I’d keep using the wrong function calls. Throw in the minor differences between MySQL and my work DBs of PostGreSQL and SQL Server, and I had trouble getting things straight some nights.
Bad words were muttered. Repeatedly.
The results so far are a few charts that I’ll describe a bit later in the post, with more to come as I start to slice and dice the data I’m getting out of SolarEdge. Mostly, I laid down a foundation for data ETL (Extract Transform Load) that will allow future developments to be faster.
SolarEdge API Details
You can see the tech specs of the SolarEdge API in this PDF, but of course to use this you first need:
a SolarEdge supported system with appropriate firmware
an API Key from SolarEdge (generated by your installer in most cases)
your Site Id
a working knowledge of JSON (or the willingness to research it)
a plan of what to do with the output
SolarEdge users will know there is already a web portal they can log into to check their summaries and current power flows. It produces things like the charts I’ve used previously via screenshot:
However, for some of us, logging into the portal can be a little tedious, and sometimes the data may not be as granular as we like. Perhaps we also want to compare it in different ways.
I’ve already logged a few suggestions through to the SolarEdge API development team, particularly in regard to battery-related data. It will help me develop new tools for Powerwall reporting in future.
Another thing to be aware of is regional differences. I was having a twitter DM brainstorm with a top bloke in Buffalo (hey Eric!) about the differences in data he was seeing. It appears that certain things we get in the SolarEdge Monitoring Portal in Australia are different to the USA.
I also know from personal experience that a previous firmware version on my SE5000 didn’t support monitoring of particular power flows.
Eric and a mate of his put up a GitHub Repo with some Google Sheets on it to pull data back. Recommend you have a look as they have good instructions and have cracked most of the eggs for that omelette.
SolarEdge API for UTP
My approach is a little more bespoke, because I’m of the opinion that my way is the best way, or at least the most interesting (*ahem*).
The SolarEdge API lists a limit of 300 calls per diem, which is fair enough, and I had PHP to get it, and MySQL to store it. After a bit of testing in Postman (REST Client) I settled on an initial strategy, to schedule calls every 15 minutes for two primary data flows in the SolarEdge API document.
Power Flow
/currentPowerFlow – a fairly simple summary of what power flows in the system, with source and destination mapped.
It seems to be used for this readout in the SolarEdge Monitoring Portal.
Source
Graphic
Destination(s)
Notes
GRID
Power lines
LOAD
Export is +ve, Import is -ve
LOAD
House
GRID
Current consumption
PV
Solar Panels
STORAGE, LOAD
Can feed both
STORAGE
Battery
LOAD
Charging / Discharging
This data is it is not provided with a time stamp, which gives me a bit of pause; the accuracy of what this API call is doing against others with time stamps creates doubt. So I am making a few assumptions for now.
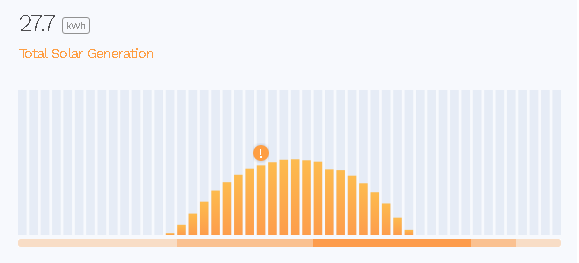
At present I’m using the retrieved data to track battery charge through both the fuel gauge on the side panel (to your right), and a battery charge line graph, which is not published on any other pages.
The latter operates on a rolling 24 hour basis, and was mainly done as a simple test of the WP Business Intelligence Lite plugin.
That said, its still pretty cool to know when the Powerwall got back up to full during the day. And its important to note that the SolarEdge API always reports “Full” as 98% and never above. I can live with that.
Power Details
/powerDetails is an API that gives power movement over a submitted time interval, broken down in 15 minute reads. This is a little different from the above, in that it doesn’t reference devices specifically, just the Watts that are flowing in the major categories of the system.
Term
Meaning
Notes
Consumption
House usage
Sourced from grid, battery, or panels
SelfConsumption
Self use
Usage covered by Production
Production
System output
Total of Solar PV + Powerwall output
FeedIn
Export
Power fed to grid
Purchased
Import
Power purchased from grid
The aim of the chart is to give at-a-glance notice of what is happening in the system, also on a rolling 24-hour basis. I have joined this data with some of the battery stats from currentPowerFlow.
And yes, I realise this is a mess, and will make it nicer in the coming weeks.
Joining data like that presents an issue, as they’re sourced from different API calls. As a result, there is no guarantee of accuracy because time-based joining of two datasets might represent different system states.
The fact that they run within milliseconds of each other is not quite good enough. You’ll see that inaccuracy borne out by “Powerwall Discharging” line spikes occasionally lagging behind the Consumption/Self Consumption spikes.
Overall, I’m happy if the “Importing” line stays near zero, and the “Consuming” line never goes above the “Consuming Own Power”. That means I’m catering for all my own needs with the system I have.
Tying it Together
There is little point to any of this unless you can automate it. I’m big on automation, and after building my own scheduler for PHP, I still didn’t have access to a cron-like tool with my current host.
Nor was I going to pay monthly fees to kick things off via Pingdom or other services – lack of capital, you understand.
Someone at work suggested using a Google Sheet script, with a per-minute trigger, to consume a page that simply called the scheduler function. Bam! Automation! Works pretty well, particularly for that kind of money i.e. zero dollars.
Total code base for doing this is about 480 lines of PHP total, excluding plugins for chart. I’m big on whitespace and comments, so its more like 200 functional lines.
Next Steps
There are some other APIs I’m looking into, and of course I’ll be thinking about new chart types in order to give some interesting insights.
I was also presented with a request, this very day, to make data downloadable in CSV or JSON format. That might have to wait until I’ve got a bigger dataset to report on, or more ETL running, or get a few feature requests done by the good people at SolarEdge.
Conclusions
Seeing these things in my own charts has led me to ask a few questions of the system itself. If I’ve got a near-full battery, and panels running hot, why am I ever importing power? My personal theory comes down to one of two things:
(A) Its a false read created by internal calculation errors, or inverter feedback of some kind; or
(B) The inverter, for whatever reason, isn’t responding to surges quickly enough to cover use from the solar panels or Powerwall.
I’m going to start keeping an eye on the smart meter I have installed to see which is more likely, based on the import/export it is reporting.
We shall see.
As I got halfway into typing this, I realised I hadn’t observed Earth Hour (19th March 2030-2130 hours) in any way. For the record, I only used 0.41kWh today, only a tiny bit of which was during Earth Hour.
Though maybe that was a false reading based on (A) above…
My solar system has now generated over a MWh (Megawatt Hour) since it was installed in late March with the Powerwall. Essentially that means my panels have generated…
wait for it…
zoom in to close up …
One Million Watts!
Yep, that’s lame, but I’ve been waiting to kick that off for weeks now. And some would say that picture has a striking resemblance to me.
On average that makes it a bit over 25kWh per day solar power generated, which is quite good considering we had a few cloudy days. Record day so far is about 33kWh generated, which might get broken around the summer solstice next year when the days are a bit longer.
March in Australia generally resembles February, but at this stage it is even warmer than usual in Sydney. You can read a really good summary at The Conversation about why its happening this year in particular.
I’m also following 9th Dan Chart-Master, Ketan Joshi on twitter, to see what statistical wizardry he’ll come up with next in terms of climate science and weather patterns.
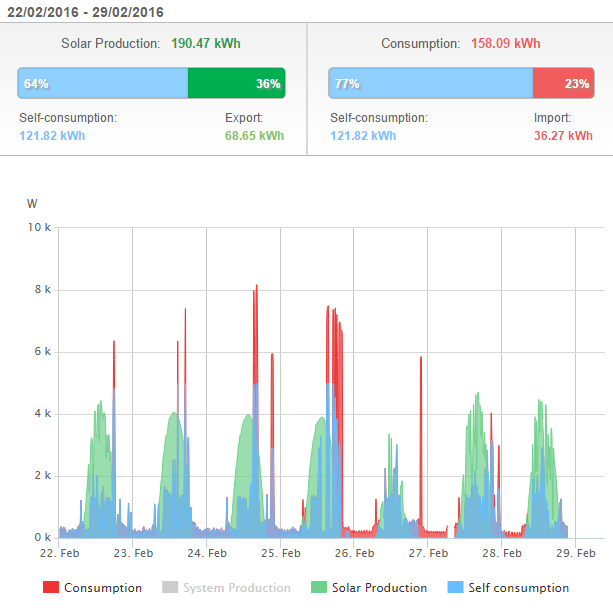
This record period above 26oC (79oF) has certainly provided some amazing solar power statistics for the first week in June.
Fairly healthy rates for import and export, and its just a shame I’m yet to take advantage of feed-in tariff. I’m still awaiting changeover to Diamond Energy so I can take full advantage of Reposit Power with the Powerwall later this month. SO excited. GridCredits!!!
If I was on my current provider’s plan (which I’m not because I’d have to sign a new agreement), I’d have imported about $1.70 worth of power after all discounts, and made about $4.40 in feed-in tariff. Throw in 7 days of connection charges of $4.94 after discounts, and I’m $2.24 in the red, theoretically.
However, I’ve consumed 110.17kWh of my own making, or nearly 16kWh per day. That is actually pretty low against the household average over the year (~20) and if I didn’t have solar panels, that 110.17kWh + connection fees would be somewhere in the order of $31.70.
So really, when you think about it, I’m almost $30 to the good!
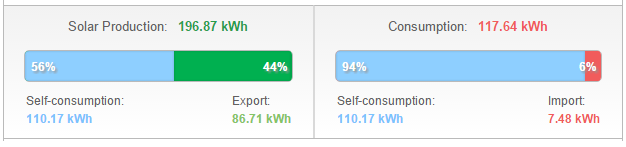
Right at the start of you can see a little red block. This was an anomaly where the battery management firmware was confused by 29th February (Leap Day). Yeah, as a developer I can tell you it happens, occasionally. I’m assured its fixed, and because we’re on daylight savings time right now it started at 1AM on the 29th Feb and went through until 1AM on 1st March. Cool.
There is a big spike on 3rd March which was air conditioning going on for a very warm afternoon. On the morning of 7th March the battery finally went to sleep after the previous evening’s efforts cooking dinner and dessert.
Why burn stored energy doing all that baking in the evening? Firstly, it was a work day, but mostly, let’s just say that you can’t put obsessive battery monitoring ahead of my wife’s roast chicken, followed up by chocolate cake. You just don’t.
Our electric oven is running a bit out of kilter at the moment, judging by the noise coming out of the fan assembly. I’m getting that rectified next week, which should decrease duration of usage, by providing a more efficient cooking cycle. Moar cakez!
I recently added a new network attached storage (NAS) for backup duties, after the old one finally threw a shoe – i.e. one of its RAID partitions. The new one has power recovery so can handle being on a timer, along with the TV and games console running from that outlet. Only a few watts saved, but every bit counts when you’re trying to get the battery through the night as often as possible, under varying circumstances.
Powerwall Zen
As I’ve learned a bit more about the Powerwall, I’ve also tweaked some of the larger hardware pieces to exist in harmony with each other and the solar system in general.
For example, the pool pump needs to be running for a certain number of hours per day to ensure cleanliness, and takes about 0.8kWh at standard operation. I’ve worked out the pump capacity (Qmax) and rate of flow correctly, to ensure I use only the minimum hours per day. I also figured out that running it later in the day allows the battery to top up earlier as the panels start cranking up the flow mid-morning.
In partnership with this, the timer on both our washing machine and dishwasher are set for the early afternoon, when the sun is at its highest. I leave a gap in the pool timer of 2 hours in the middle of the day so both these devices can run without issue, even when the sun isn’t so bright.
As always, a solidly overcast day can throw some of these plans out of whack, and that’s why a grid connection is a must. Beyond keeping the warranty of the Powerwall at 10 years (off-grid is only 4), in suburbia there is simply no reason to disconnect, with the grid as your fallback.
And I’m only a couple of weeks away from generating GridCredits, getting the battery topped up before the 2PM peak boundary makes sense both financially, and from the data it will provide to advance our knowledge of micro-grids in a modern urban environment.
Now, if you’ll excuse me, I smell cinnamon cupcakes baking…
In my last post I alluded to having some thoughts on whether my house was making the most of solar power, particularly in regard to how I was using it. Knowledge is power, and the knowledge I’ve gained in the past few of weeks of my solar power usage has been very interesting.
Understanding which appliances burn the most power, what the usage patterns are, and the effect of weather, are all critical to getting the most out of the investment. This ensures that I can achieve the ROI I want, and that I’m a responsible user of any fossil fuel energy I’m required to draw from the grid.
Though the weather today was pretty good.
In all my analyses, the ducted air conditioner keeps cropping up as the villain (and at some point I’ll reconcile myself to that).
Its a difficult issue to address, as ripping it out of the roof space and replacing it with something else would just cost a load of money, and may not practically address the issue of solar power for cooling on a bang-for-buck basis. I need to ensure I’ve investigated other ways to either offset its use, or reduce my reliance on it.
Air conditioning comes down to a simple premise: comfort. You use it because you have too much outdoors in your indoors, so to speak.
That’s not a bad thing in the world of modern convenience, where our cars, offices, and houses are all air conditioned. However, have you ever thought that air conditioning is just treating a symptom of the main problem, and not the root cause?
The root cause – intrusive heat in this case – is going unaddressed. Even if you have a really efficient unit with all the bells and whistles, you may be able to do even better through other, more practical means.
Beyond “don’t leave the door open!”, there are many factors affecting your use of air conditioning or heating, often reflected in the design and quality of your building. Do you have adequate insulation of suitable quality? When was the last time you had it checked? Gaps around the doors? What about covering the windows?
Windows are a general weak point for heat transfer into or out of a building, particularly in large parts of Australia, where we don’t suffer the kind of harsh winters that require central heating or double glazing.
As a design point, a lot of modern houses here open up windows far more, which often results in more energy usage. One design element I need to deal with in my house are the large, west-facing windows.
About 8 square metres of glass, pictured at 1PM Sydney time today, before the sun hit
Both windows are in the same room at the front of the house, are 1800mm (6 feet) high, with the one on the left nearly square and the other about 2700mm (9 feet) wide, getting hit by sun all afternoon. The internal venetian blinds, while slowing the direct heat down a little, aren’t stopping it from advancing into the room in the first place.
Simple science: the sun hits the glass, which heats up, subsequently transferring its heat to the cooler air inside that is right up against the glass. That air rises (because heat) and more cool air is drawn against the glass. Rinse and repeat for 4-5 hours on a hot Aussie summer day!
Some people also look at tinting their windows or installing double-glazing to assist with this, but I remain unconvinced about either option in terms of value-for-money in most parts of Australia.
Tinting provides an extremely thin buffer, so it is only going to slow things to a certain degree – better than nothing of course, and relatively cheap compared to other methods. The downside is that in winter its going to perform the same function, stopping heat from entering the house via those windows. As a side note, the privacy aspect of tinting is lost when the lights inside are brighter than the lights outside i.e. at night when you are using that space.
Double (or triple) glazing is the architectural method of choice for sound proofing and insulation of glass. While its overall effectiveness year-round as an insulator cannot be questioned, the expense often makes the average home owner hesitate. Double-glazing in summer is best used where you can keep the internal temperature cool, and therefore stabilise the buffer between glass panes at a temperature somewhere between the outside and the inside. Generally speaking, if you’re not keeping the room cool through e.g. air con, the buffer will heat up, and start transferring that heat into the room.
In my opinion, and that of several electricity companies, the best way to stop this kind of heat transfer is to stop the heat hitting the glass in the first place. In essence, you create an external buffer zone where the sun’s heat and UV rays can’t get to the glass in the first place.
There are several options available, from adjustable fabric awnings, metal shutters, louvres, window shades or fixed awnings.
Rather than run out and spend a pile of money on anything custom-made for those windows, I decided to experiment first on our north-facing garage window. In the garage I have a network cabinet* in which I have my network backbone with appropriate patch panel for all the points around the house. I don’t want that equipment to overheat, and shielding that window should help prevent that.
* on reflection, probably a mistake to put it there, but it wasn’t going anywhere inside the house, according to my wife. Its called “compromise” I think…
Window coverings
I went to Bunnings Warehouse and, for the princely sum of $297, bought a fabric awning (1800mm wide, 2100mm drop) to cover the garage window from the worst of the heat. That’s it on the right, and I put it up myself in about an hour.
The awning can quickly be retracted in case a storm blows up, or in winter when I want the sun to warm up that side of the house. Sydney winters may not be harsh with snow and such, but we tend to have low tolerance for cold as a result ?
I’m going to keep an eye on this for the next couple of weeks, as we move into cooler months, and see how it performs as the sun moves back north and puts more sun on this window.
Some (including my wife) may say that these kinds of awnings are a bit daggy, and yes you can buy them in stripy patterns if you want to be reminded of your grandparents’ post-war bungalow. However, if they do the job then I think for next summer I’ll be pushing to cover the rest of the problem glass on the north and west sides of the house.
It will be a battle royale between her Better Homes and Gardens and my New Scientist approach to this whole thing.
In the meantime, the best we can do is shut the problem room off during the heat of the day and let it become the buffer zone. My issue with that longer term is the electronic equipment in that room is under strain during that time from heat. And its the rumpus room for the kids, so now I have them in the main room watching my TV!
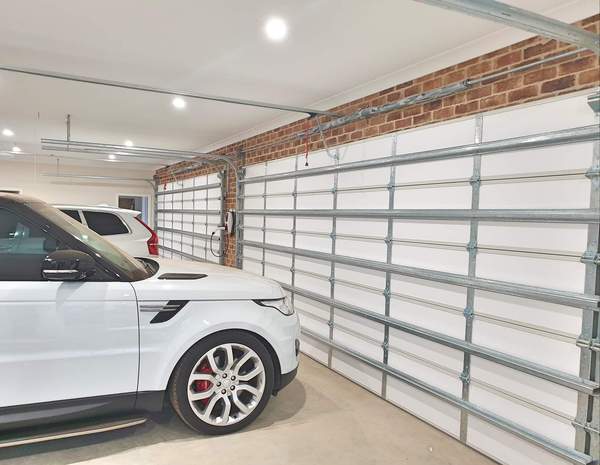
Garage door
The double garage door also faces west, and therefore gets a lot of heat in the afternoon. That was an issue from the day we moved in (late 2013), so after a bit of research I bought a roll of Green Insulation Reflecta-GDI which looks a bit like this once fitted.
Reflecta Garage Door InsulationIt definitely works – I can’t touch the bare metal of the door for more than a few seconds on a hot day like today (35oC / 95oF in the sun), while the insulation is merely warm , slowing the heat transfer into the space.
Measure your door panels before you order and, once fitted, you may need to recalibrate the garage door lifter to account for any weight change (it isn’t much but some units are sensitive). No adhesive required as it designed to fit most modern panel garage doors in Australia by sliding into the space at the correct width. That is actually a shot of it overhead – no issues whatsoever with staying in place in over two years.
While we’re on the topic of garage heat, DON’T close your garage door immediately in summer after you park the car in there. The heat you trap will radiate into the house through plasterboard before it will escape through brick or wall insulation. Leave the door up and get some air flowing through the place for at least half an hour.
Not so bad to trap that car heat in winter, but make sure the engine is off!
Solar Power Design – more than panels
If you’re in the process of building or renovating, you may have already made a lot of decisions around how you wants things to look. Some of those things may focus on solar power, while many more are about the right fittings, colours, and facade for your home.
Those with solar power aspirations will already know how important aspect is, though after discovering what I have about my own house, I believe it should be more than how many panels your roof can hold.
If you haven’t adequately considered the thermal efficiency of your home, you may not be capitalising on your investment properly.
Even if you’re not considering solar power for your house at this point, you might think about getting the place pre-wired while the build is occurring, as Jennian Homes in New Zealand is doing with all new builds.
Consider the design factors around your insulation (wall and ceiling) as well as windows and cooling or heating options. Sometimes these things can be lost when you’re focus is on the right marble bench top, or the right tapware.
The builder may promise the latest, you-beaut ducted AC, but it may end up costing you more over the longer term. Look instead at smaller, more efficient air conditioners (like split systems) to cool or heat the space you need. In either case, make sure you understand the energy requirements of these add-on extras and how they will affect your power usage.
A few little decisions now can save you hundreds or thousands in the future, particularly as prices rise (and they will) and governments feel pressure to adopt renewables standards across the world.