Reposit Power and the Microgrid
As already sprayed around on twitter, I have a system installed within my solar domain from a startup called Reposit Power. When I first discussed the install with Natural Solar this was one of the key points in the install; a smart way to use battery power, as well as help reduce my costs.
If you didn’t watch the video, in a nutshell:
Reposit Power provides controller software that adds smarts to the system I have, as well as offering the ability to sell battery power to the grid during peak events (GridCredits).
The SolarEdge inverter with StorEdge Battery interface is quite happy playing with the Powerwall. When the sun is out, it powers the house, directs any leftover to the Powerwall, and exports the rest. Battery is called on when solar is not available. Simples.
Reposit Power takes this ecosystem and adds a layer of predictive analysis, including my usage patterns, type of energy tariffs, and weather patterns, to decide on the best way to manage this power on my behalf.
This is the kind of technology that other companies are selling out of the box, but Reposit are making it applicable to multiple systems. This device-agnostic approach is very important as we move deeper into the IoT (Internet of Things), particularly with connected energy systems.
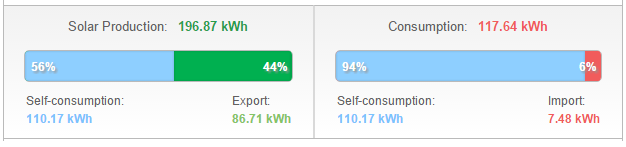
Reposit Power also provide a sexy, sexy web interface for looking at power usage. Here is a sample from 13th May:
It has a level of granularity slightly better than the SolarEdge web interface, which is really useful to understand house consumption in particular.
My favourite thing about the image above is the Solar generated – almost a perfect curve, gracefully rising from 0720 hours to 3.6kW through midday, and then falling to zero again just before 1700. Beautiful…
Fine… but what does it mean?
At the moment, I’m probably not taking full advantage of the Reposit setup, because I am trying to be the smarts in the system. And while I’m a control freak, there are factors beyond my control.
The guiding philosophy is to use devices when the sun is out, and get the battery to run the house when its not. Life sometimes gets in the way of that, though more often its cloud cover getting in the way of that.
A couple of days in a row of decent cloud cover, or rain, and the battery is going to roll over and go to sleep until the sun comes out again. As we head into winter here in Australia, daylight hours will shorten somewhat.
(I’m still cranking 20+ kWh on a clear day in which is doing alright for a latitude of 33.7S).
If I’m importing power from the grid once the battery gets low, I’m paying a bit over 20c / kWh for it. That means I might spend $3 on power on a day where I have cloud cover, looking at the average consumption.
Winter will require more power consumed on heating, so that cost will go up on a cloudy day. Single rate electricity tariff gives me a level of surety with my consumption, but perhaps to maximise the benefit, we need to shift our thinking and take a bit of a risk.
Reposit Power to the rescue?
In discussions with the guys at Reposit, I’m considering moving to a TOU (Time Of Use) tariff with Diamond Energy. Let’s look at the costs involved in TOU before any discounts apply:
| Rate Description | Time Period | Cost inc GST |
| Daily Supply Charge | – | 101.20c / day |
| Peak Rate | 1300-2000 business days | 32.84c / kWh |
| Shoulder Rate | 0700-1300 business days0700-2200 weekends
0700-2200 public holidays |
25.30c / kWh |
| Off-peak Rate | 2200-0700 every day | 12.27c / kWh |
Compared to the current single-rate of 82.45c / day for supply charge, and the 21.29c / kWh for usage, this could be either terrifying or awesome.
The connection fee increase to go TOU from single-rate is nearly 23%. Over a billing period (quarterly) is a difference of just over $17, or $68.25 in a year. Not huge, but I’m trying to get as close to zero as possible; the related benefits have to stack up.
Peak rates are going to be the killer – 54% higher than single-rate. Ouch.
Shoulder power rates are nearly 19% more expensive than single-rate, which is where quite a bit of our usage probably sits, based on my quick API-based calculations. That is something to put a red line under in considering the switch.
Off-peak power is while off-peak is 42% cheaper than single-rate, so can it help?
Certainly – running the dishwasher overnight is an obvious one, as it has water heating requirements. Water has the highest specific heat of any regular household substance (unless you’re heating Helium or Hydrogen* gases), and therefore needs a lot of power to do it, if only in peaks.
*Author’s note: if you’re thinking about heating Hydrogen gas in your home, just don’t.
What about other devices? Washing machine run before 0700? Perhaps, but ours draws gas-fired hot water so its not a big deal. Hanging washing on a cold winter’s morning doesn’t sound like fun, either.
Oven? Generally not cooking anything between 10PM and 7AM at night. We tend to be asleep or generally less active (and hungry) at those times.
Air conditioner springs to mind as something that needs to operate off-peak as much as possible, particularly in winter where we are warming up the house before getting out of bed. We have a reverse cycle ducted system which sucks a lot of power to cool, so probably a similar amount to heat.
If we had off-peak power, we could time our heating and cooling to maximise use of off-peak power, though that is less useful in summer when the heat is coming in the afternoon i.e. during peak.
However, if we’re talking about the ability to effectively use off-peak power, we need to consider the most useful device on the premises.
If Sydney is going through a cloudy period, and I’m not able to generate enough solar power to both run the house and fill the Powerwall, why not use off-peak power to do it?
Even though its one of the stated benefits of the Powerwall (time-shifting solar and off-peak power) I wasn’t really considering how to do it until Reposit Power came along.
The Reposit Power box is capable of analysing my usage patterns, and understanding that I get up around 0700 every day, flick on a few devices (not simultaneously if I can help it) and make breakfast. Over time it gains an understanding of how much electricity I require for breakfast.
So, if I moved to off-peak power, Reposit could pull that off-peak power in, and reduce my breakfast costs by 42% on days where I don’t have the battery to boil the kettle, compared to what I have today.
What if its a wet week? At the moment I’d trickle a bit of solar into the house, maybe the battery, but my import costs would climb at a set rate of 21.29c / kWh.
If I move to off-peak, Reposit could pull in 6kWh at 42% lower cost, and deploy that power at peak time to avoid the higher rate. I’d take a bit of a hit on the shoulder time, but would be better off overall if the figures work out.
My next step is to look into the exact numbers, and discuss some points of interest with the guys at Reposit Power. Scientifically speaking, I’d like to just let this single-rate billing period finish, then switch over to TOU for the next quarter and look at the results.
Yes, it would be an Autumn compared to Winter comparison, but in theory Winter should be even better for this strategy.
Whether I stop being lazy and look at the figures might be irrelevant in light of another factor introduced by Reposit Power…
GridCredits FTW!
At the moment, I get 8c / kWh for exporting power off my solar generation. Not crash hot, but not bad either compared to some in the Australian market.
One of the reasons for the low rate compared to what I pay for electricity is that solar generation is not a guaranteed resource. It peaks and troughs with available sunlight, and of course doesn’t run at night.
If you go back to the table on power pricing with Diamond Energy, you’ll see “peak” runs from 1300-2000 hours business days. This is generally when most power is required, so companies can sell power for a higher rate as they crank up the hamster wheels.
Even though my solar may be exporting during peak times, the environment today is such that the pricing is not adaptive. Firstly the technology doesn’t really exist at a network level, and secondly the power companies are keen to maximise their projected profit.
This is where GridCredits step in, and home storage steps up.
Anything I have stored in the Powerwall is guaranteed power. Besides a minor amount of efficiency lost in transmission, if I have a full Powerwall, I have about 6kWh available that could go into the grid to help smooth a demand surge peak.
Of course, given this is now a guaranteed source of power, and isn’t subject to interruption from the sun disappearing, I’m going to want decent compensation for it. That compensation works out to a figure state as “up to $1 / kWh”. Yep, a whole, tasty dollar.
And if its a bright day, I can keep pushing power into the battery from the solar panels, or exporting at 8c /kWh. Bonus!
Financially, that is a major windfall for the Pfitzner household, as the first exported kWh will pay for my supply fee that day, and any subsequent kWh exported will cover other days.
With around 77 peak events per year in Australia, with the right conditions I could get that power bill well below zero, and even pick up some beer money.
Beyond my selfish personal gain, systems like Reposit Power are a game changer for the electricity network. Long range power distribution seems a little odd when we’re capable of generating it on our rooftop.
The Rise of the Microgrid
There are a few projects around Australia at the moment that are looking at microgrids, or discrete systems that don’t require the main power grid as we know it.
Think about it like peer-to-peer power sharing. Its basically the bit torrent of electricity.
The concept of a nation- or state-wide grid will probably fade over time. Connected energy systems at the current scale are only 50 or 60 years old, and the concept of connected electricity grids just over a century to date.
I see the grid as something like the automobile, powered flight, or telecommunications. They are all recent innovations in human history, and as such are subject to more rapid change in their short life cycle.
People are naturally resistant to change, and only like a change that introduces convenience, financial benefit, or exceptionally pleasing aesthetics.
Renew Economy ran an article relating to the thought process of microgrids in Western Australia. Asset Manager for Western Power, Seàn McGoldrick, gave a talk on the peculiar set of circumstances in the west. As mentioned in the article from Giles Parkinson and Sophie Vorrath:
… when you have a service area equal in size to the entire United Kingdom, but with just one million customers (as opposed to 73 million), it’s a big challenge – economically and logistically.
The profitability of Western Power is almost nonexistent, but it is an essential service, subsidised by the West Australian State Government to the tune of half a billion dollars per annum.
What if that money could be shifted to communities, to reduce the long-term costs of network maintenance? Provide customers with reliable power, while not having to manage the poles and wires across the wide brown land?
McGoldrick presented four general approaches, and bucked for option 3 below (Modular Network).

Credit: Renew Economy, Seàn McGoldrick
If you take some of the maintenance budget out of the equation, Governments could save money, or put it into development of newer, more efficient technologies.
You create a snowball effect, that can allow low-carbon generation, electric vehicles, and storage technologies to leverage off each other.
I remember having a PC back in the day and moving to Windows. This change forced the need for better components. As CPUs got better, memory had to advance, along with graphics cards, and the motherboard technologies that tied it all together. Something similar can happen with renewables.
There are still issues around reliability for microgrids, but a combination of efficiency measures, storage, and generation diversity (e.g. wind and solar PV together, along with solar thermal) can contribute to advances across the board.
Further, it can remove the issues of the grid going down at some distant location, leaving consumers stranded.
With smarter devices, smarter management, and more efficient housing, domestic microgrid implementations can lead the way. Once the base is established, and more research money flows in, light industry can also benefit as the technology advances in leaps and bounds.
From there, we won’t just be talking about decentralising our power needs, we can start talking about decentralising our population.
If only the government would hurry up and get us a first-world internet. In an election year, anything could happen…